[PROJECT] A Dozen Chargers in the Lab
A Dozen+ Chargers in the Lab: Apple is Okay, but Not the Best
Have you ever wondered if there are ‘good’ and ‘bad’ chargers? Is there really a difference between a $5 brick you get at an airport and a $30 one you order direct from a name brand? As it turns out, cheaply made chargers can operate far differently from name-brand ones, and can sometimes be dangerous to use.
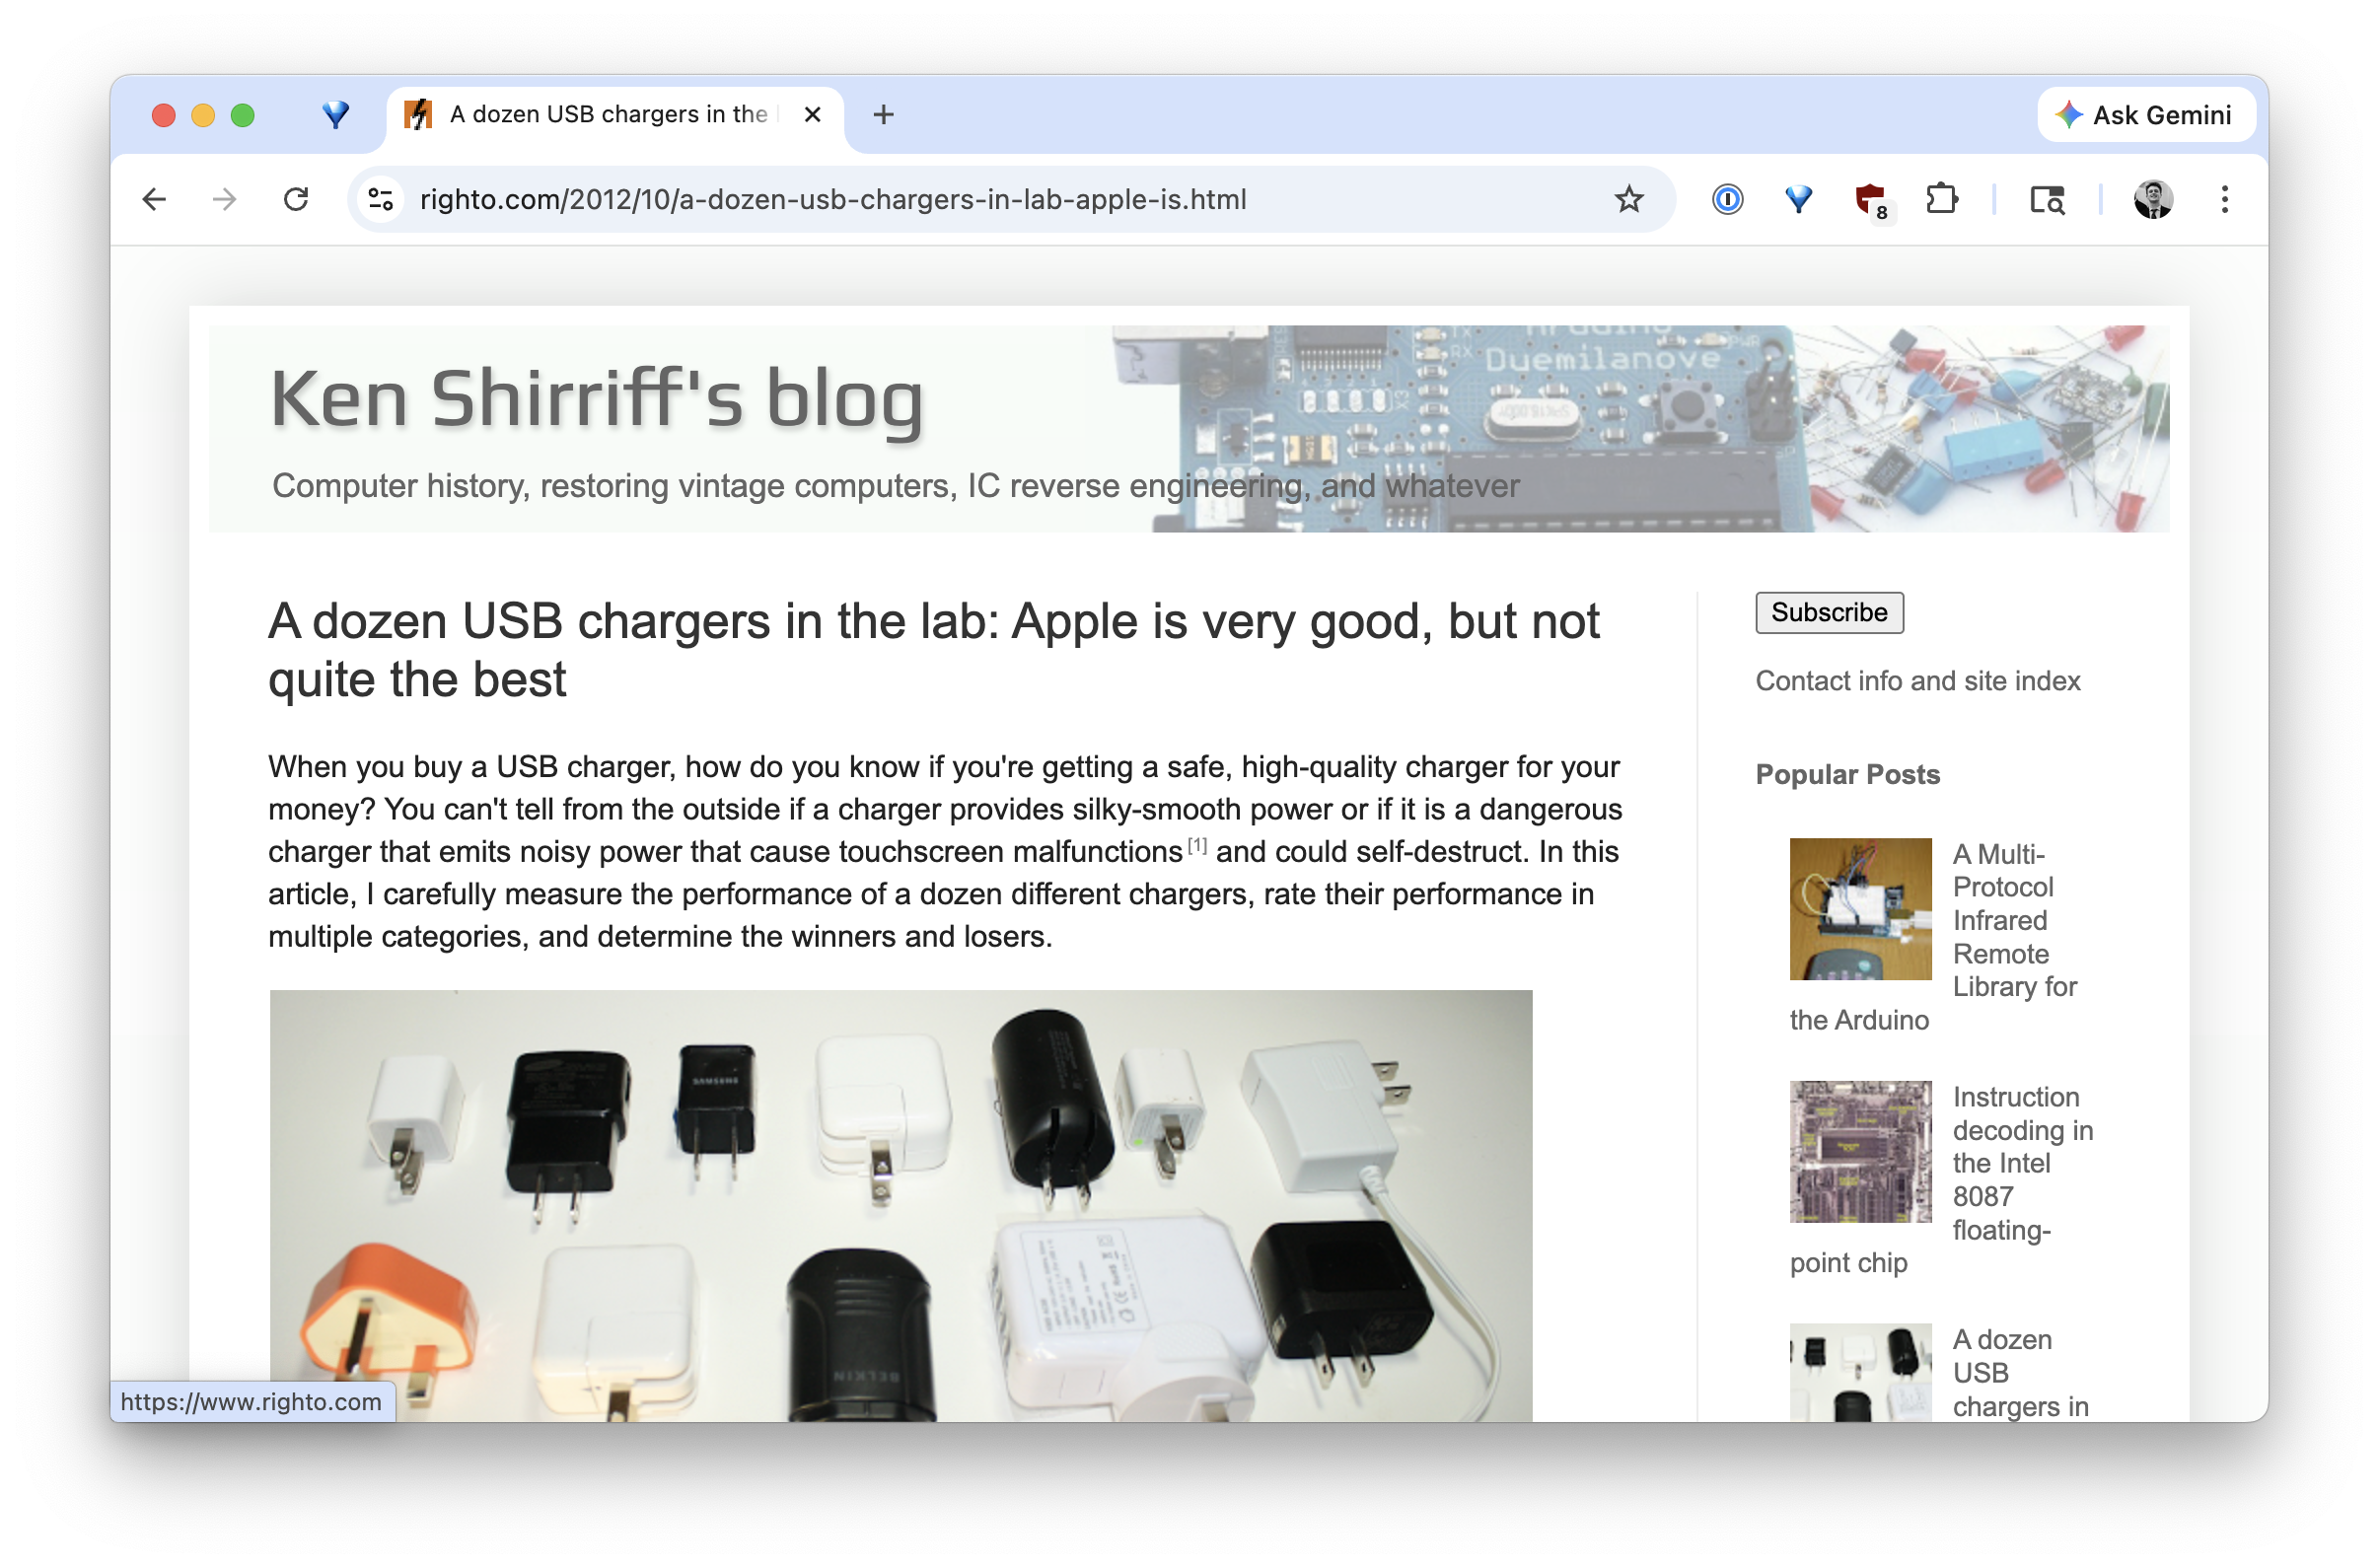
This work was done first by one Google engineer Ken Shirriff many years ago. It was at the top of Hacker News at the time, and has been reposted a couple of times. Ken made the case that there is absolutely a difference between the best and worst chargers, and that poorly built chargers have the ability to not only degrade battery life but cause other strange issues like touchscreen glitches.
Fast forward six years and it still looks like there is no real authoritative source that tests big batches of chargers like this. My friend Spencer joined along, being a mechanical engineer, and we started bouncing ideas back and forth until this project eventually came to life. He helped complete a lot of the work below - thank you, Spencer!
Here’s the synopsis of everything below:
- GaN chargers are among the best you can buy today, and the marketing around them is real.
- Cheap chargers can also perform well, so the price you pay for a charger doesn’t always correlate to its performance.
- Common brands like Apple generally do test favorably, but some smaller brands actually do better.
- There is an extreme amount of variation even within the third party brands. Some third-party produce both high-quality and extremely low-quality chargers, and you’d have no way of knowing without testing them.
What we tested
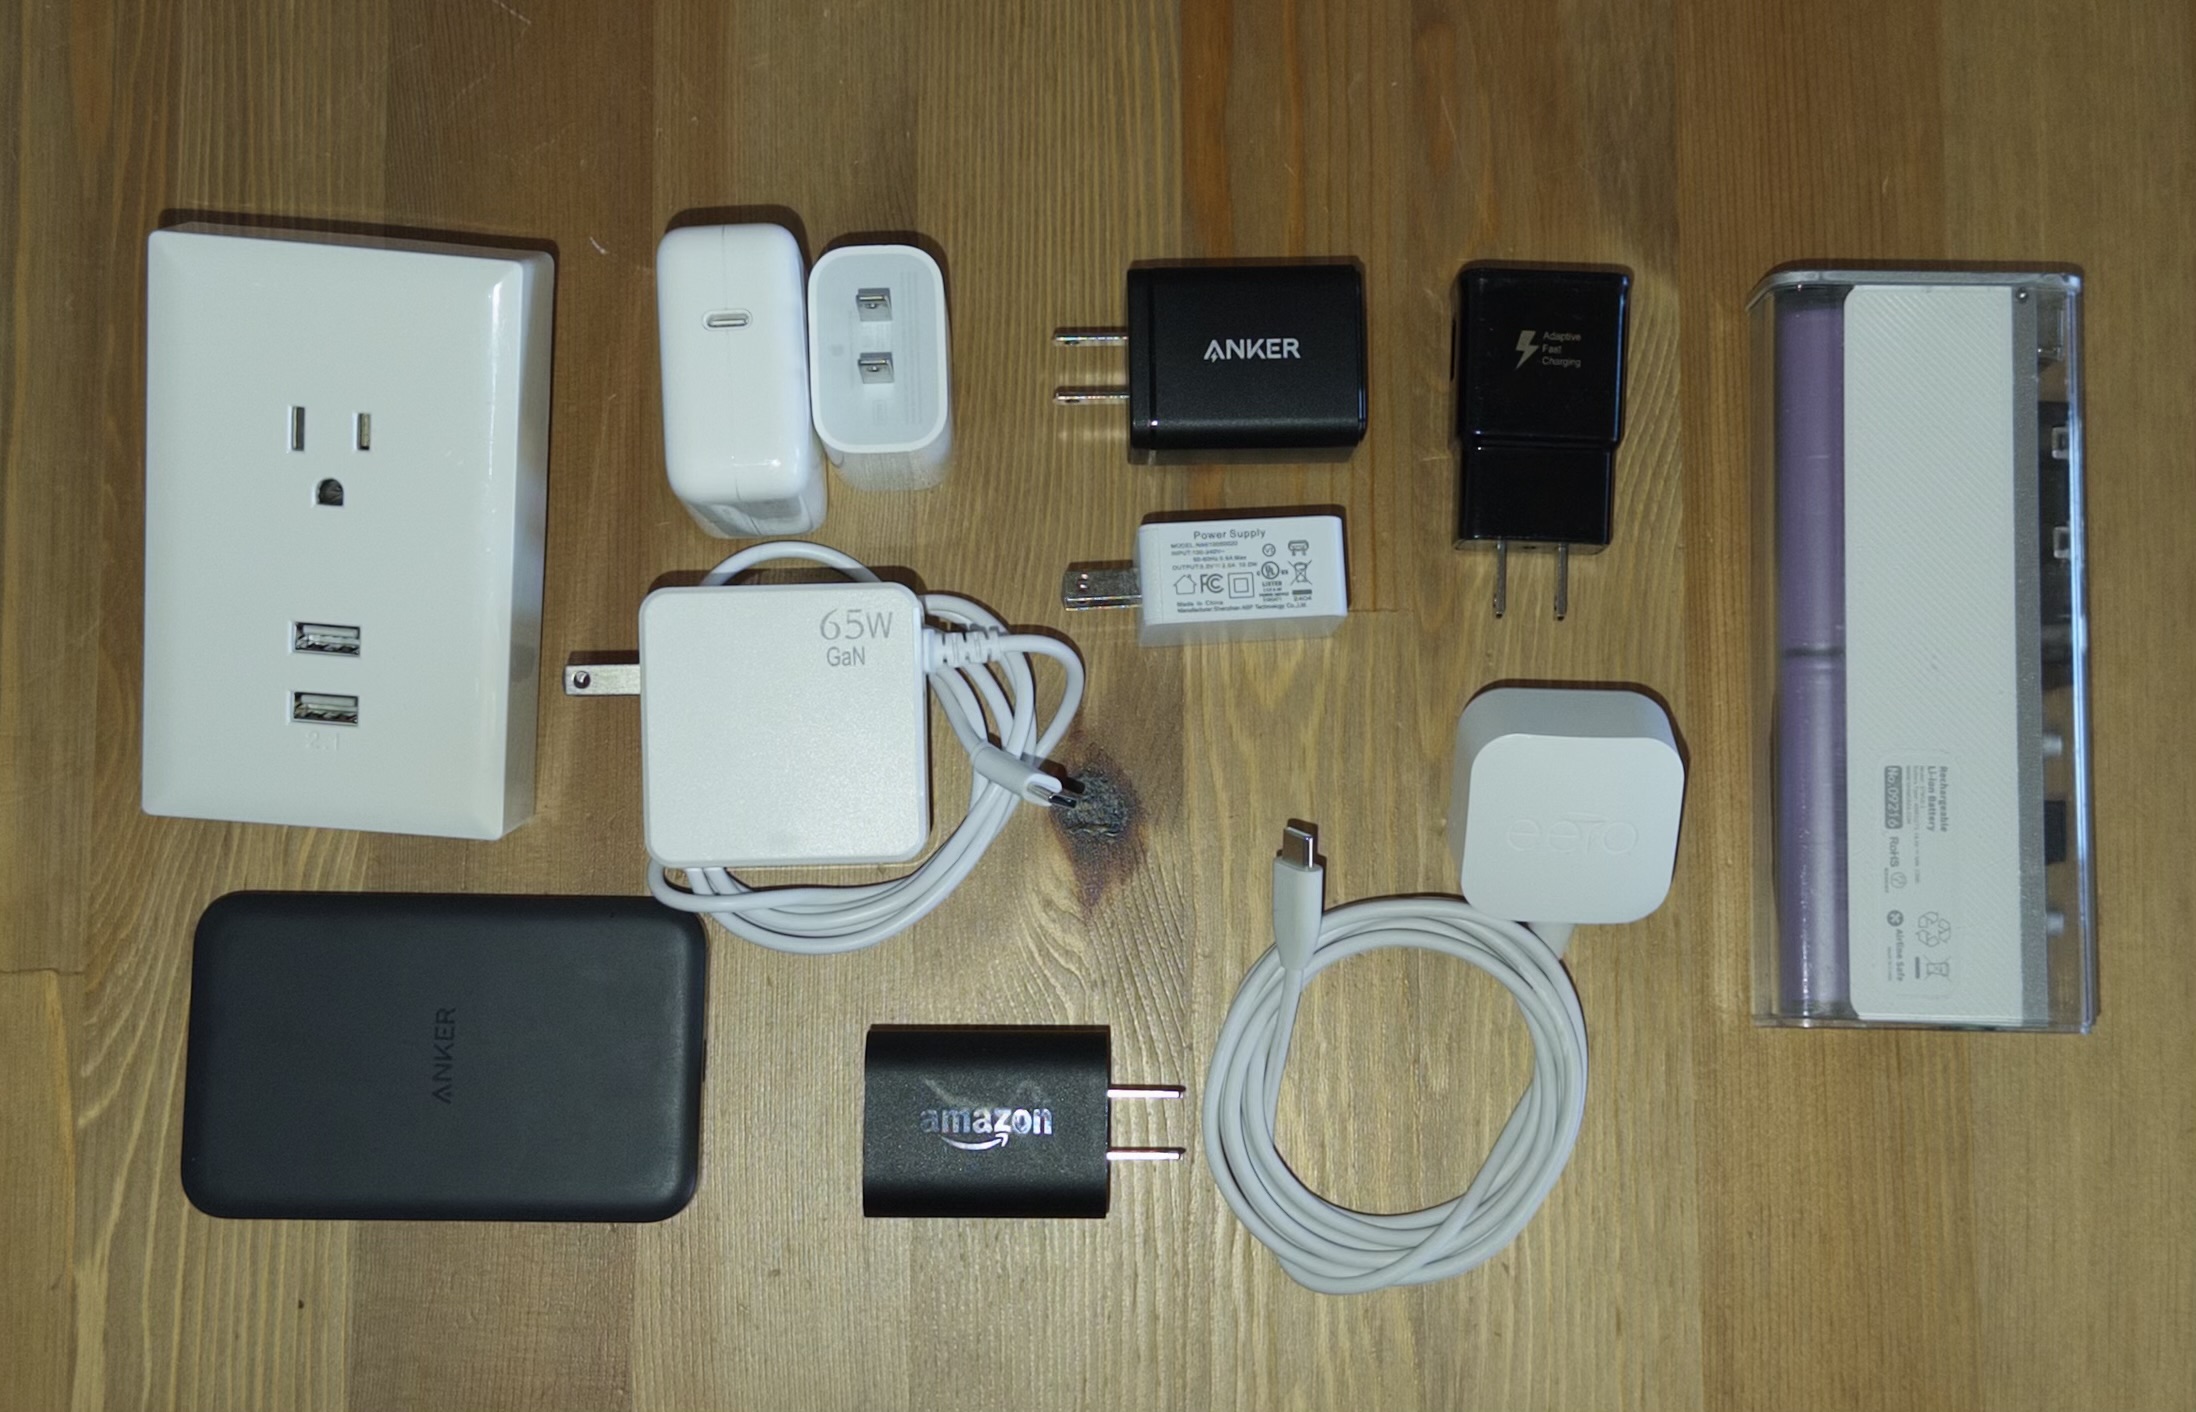
To get as much out of this project as possible, we tested a lot of chargers. Here’s the full list:
- Anker ASPD053a USB C
- Anker 637 Magnetic Charging Station (USB A port and USB C port)
- AOHI GaN 65W AOC-C019
- AOHI GaN 100W AOC-C018
- Amazon Kindle 9W PS57CP
- Dealworthy 20W PYSD-20PCQ-1CU
- SHARGEEK 35W Retro S035U
- Apple HomePod Mini A2305 (Same as Apple 20W Retail charger)
- Apple 30W Retail A2164
- Eero 15W C110011
- Anker 100W A121B GaN Flagship
- Anker Nano 45W A121D GaN Flagship
- Spigen PowerArc ArcStation Pro 30W GaN PE2013UJ
- Apple 96W Retail A2166
- VEBNER 65W PD65U55
- Govee 10W BI12T-050200-BdUU
- Counterfeit AT&T 10W ‘NA010050020’
- Counterfeit Chinese Wall Adapter 10.5W WP2UWR
- Counterfeit Samsung 10W EP-TA20JBE
There was also a Macbook Pro M1, an iPhone 17 Pro, and an Anker 621 MAG GO 5000mAh Battery thrown into the mix. These aren’t chargers, so I’ll keep them out of the list above, but they are included in the various results below.
Each charger was tested on several dimensions: Advertised power versus actual power, power quality, and overcurrent.
- Advertised power versus actual power tells you how well the charger can maintain its intended voltage while putting out maximum current.
- Power quality means the amount of noise that appears when viewing the charger with an oscilloscope. This noise comes in many forms, but the general idea is that the flatter, the less noise.
- Overcurrent shows how a charger behaves when a device tries to pull too much current. This is achieved by connecting a charger to an electronic load and having that load request more and more current until the device shuts off. It helps show how well-regulated a charger is, and if it is capable of protecting itself during load.
Testing Setup
Testing USB C chargers is a little complex. Modern chargers rely on the USB C Power Delivery (PD) standard, which generally specifies five voltages they can choose from: 5V, 9V, 12V, 15V, 20V. There are modern variants of this that complicate things even more, such as Programmable Power Supply (PPS) and Adjustable Voltage Supply (AVS), but I won’t get into those. For this project, we only looked at chargers according to the USB C PD spec. USB C PD also specifies that devices should be within +/- 5% of their advertised voltage in order to achieve certification (this is oversimplifying, but the general rule), so we followed that rule when rating them.
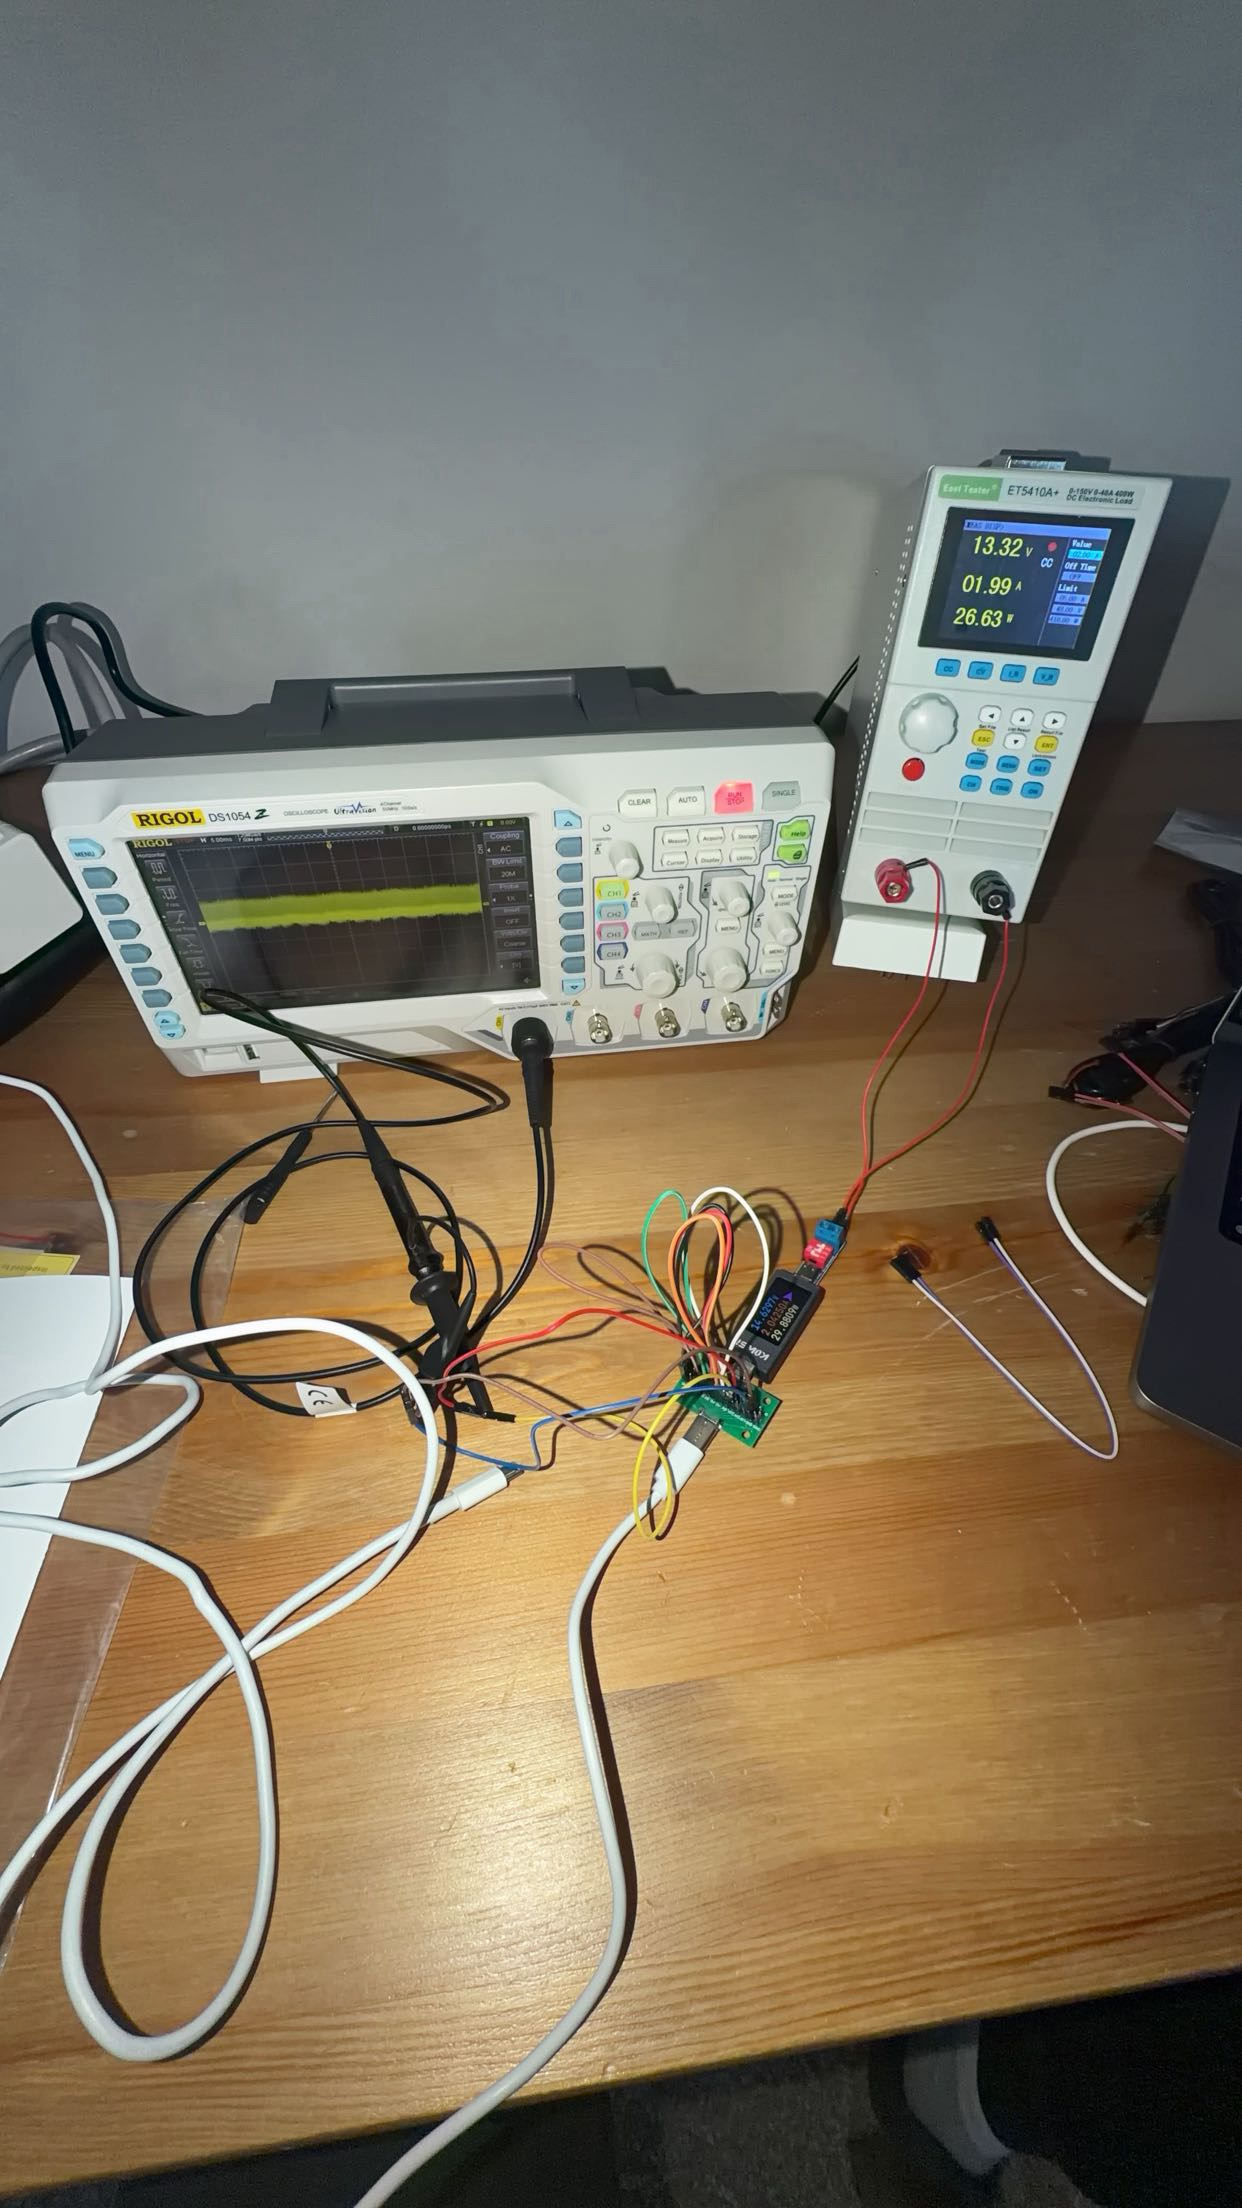
With this in mind, our setup consisted of a few different pieces:
- An oscilloscope, specifically the Rigol DS1054Z
- An electronic load
- A USB C Power Delivery decoy board
- A voltmeter
- Plenty of electrical wires and extra USB cables
The process involved connecting the charger into a power source, and connecting the other end to a USB C Decoy Board, and connecting that decoy board to an electronic load. The oscilloscope probes tapped in right at the decoy board [A1].
The decoy board was needed because the USB C PD Spec needs the load device to choose a voltage. Otherwise the charger won’t send anything. In the chargers Ken tested, most often they’d just send 5V regardless, so this setup was a little more complicated.
A note about resistance
One of the things we learned during this project was that resistance could be artificially skewing the measurements. We did a couple of things to minimize this, so it shouldn’t be a big deal.
Note
Rating system for Oscilloscope graphs
Noise and Switching Ripple
After conducting the oscilloscope tests, we rated each charger from 1 to 5, using lightning bolts as a visual. These ratings consider two separate factors: overall high-frequency noise (Vpp/spikes) and switching ripple.
- Noise includes the more chaotic high-frequency artifacts, large vertical spikes, and overall ‘fuzziness’ in the output. By measuring the overall peak-to-peak (Vpp) voltage, you can rank the true noise.
-
Switching Ripple refers to the high-frequency peaks (e.g., 50KHz, 100KHz) caused by the charger’s internal oscillator continually charging and discharging. This differs from Ken’s methodology, as he used the word Ripple specifically to mean the 120Hz line-frequency fluctuations caused by household AC power.
- Most of the chargers look incredibly dense and ‘thick’ compared to the ones Ken examined. I believe this is because my scope has a memory depth of 24 million points, while the most I saw on Ken’s graphs were around ~50,000 equivalent points of memory depth. I believe the inclusion of this raw high-frequency data at every zoom level is the most honest way to display these chargers.
For noise, the bolt ratings loosely map to measured peak-to-peak voltage noise on the oscilloscope:
- 1 bolt: over ~250mV
- 2 bolts: under ~250mV
- 3 bolts: under ~160mV
- 4 bolts: under ~100mV
- 5 bolts: under ~80mV
These are just general guidelines. I used my judgment for each charger based on everything we could see, including the shape of the waveform and the FFT spectrum, not just the raw mV reading.
The Results
Scroll through the cards and click any one to expand the full oscilloscope graphs. Each card shows the worst graph that we could reproduce for that charger, assuming typical power usage.
Note
- We learned during testing that all devices showed similar noise profiles at different voltages, so we stuck with lower voltages for these screenshots. Most screenshots below were taken when the charger was giving 9V.
- Within each voltage, we cycled through each charger's range of allowable current, and usually selected the worst graph. If the charger showed noise at the extreme low or high end of current, but no issues for the vast majority of measurements, we'd take the less severe graph. This is because what you're seeing should approximate the noise your device would actually experience during charging, not some hypothetical rating you will never actually see during normal usage.
A few more details on noise and ripple
They look confusing at first glance, but you don’t need to be an electrical engineer to understand these next graphs.
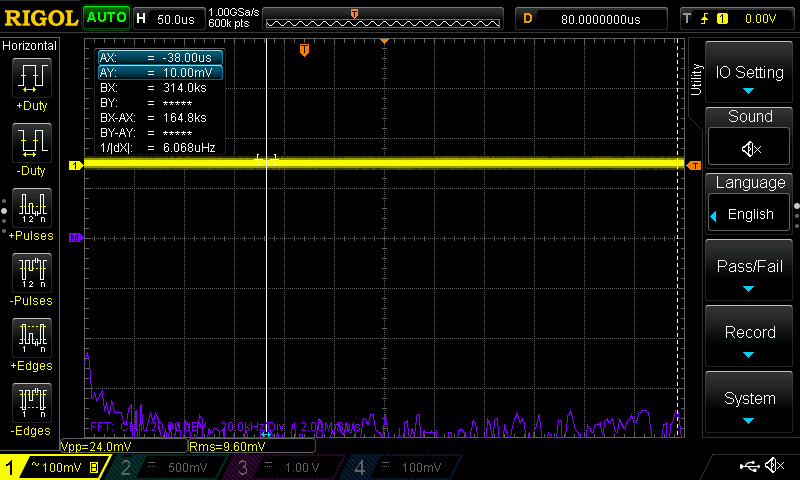
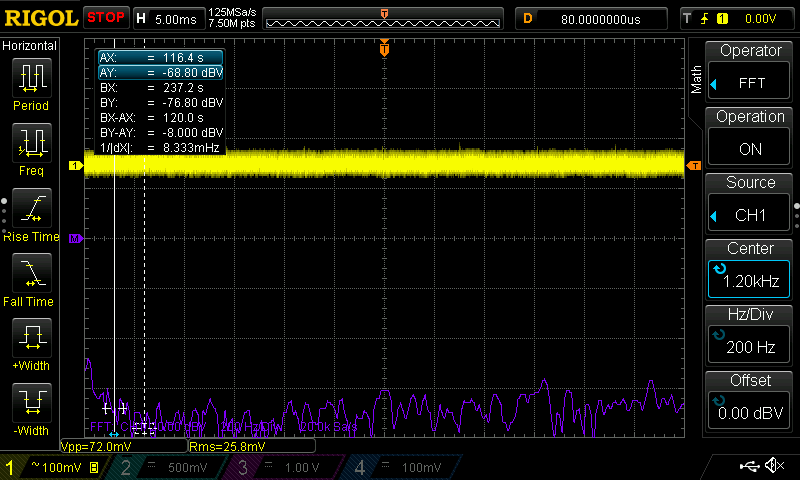
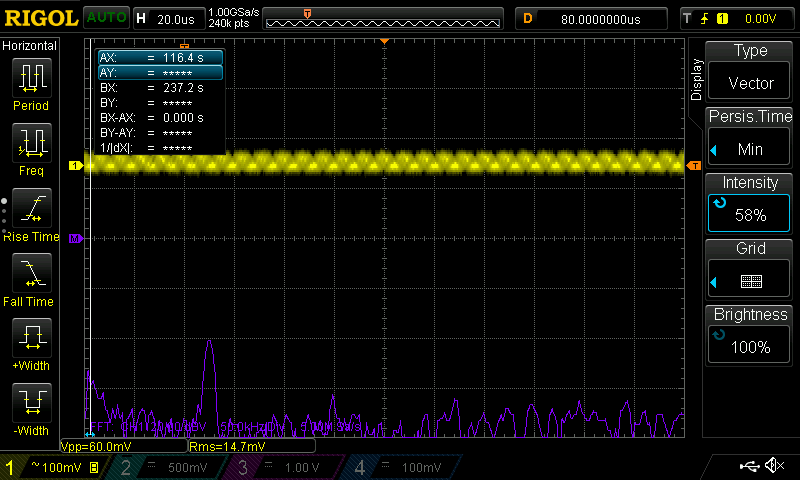
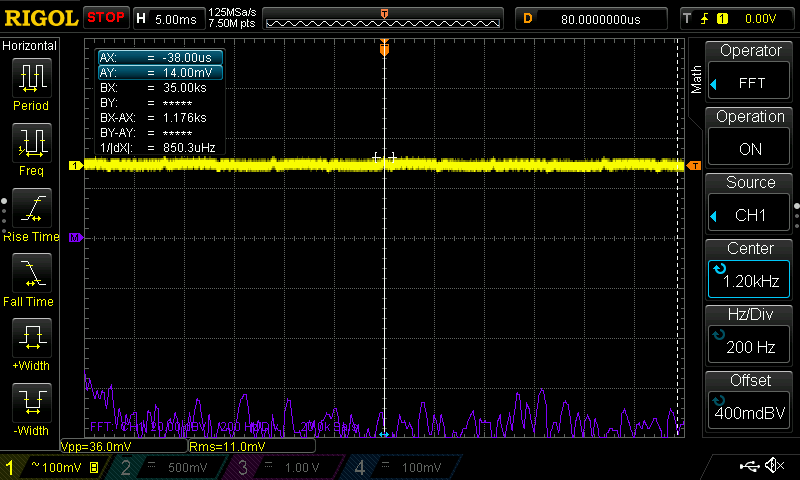
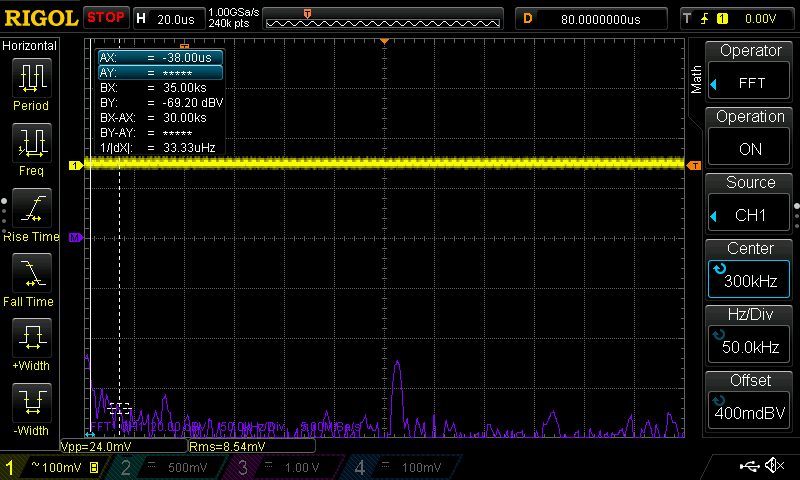
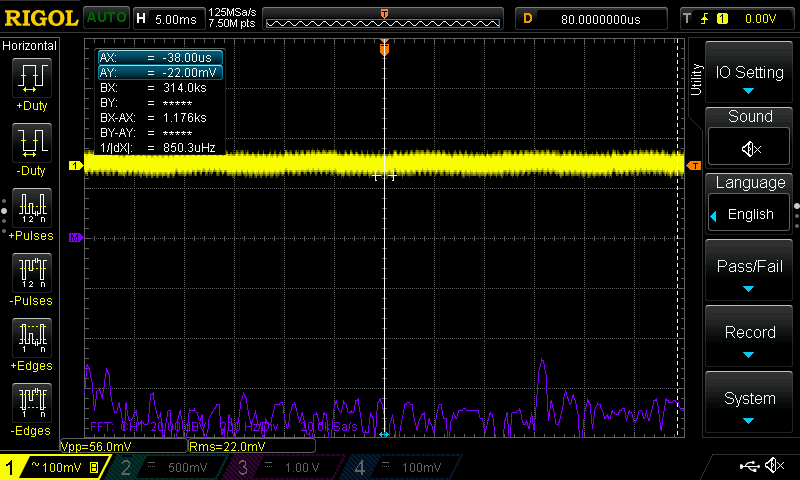
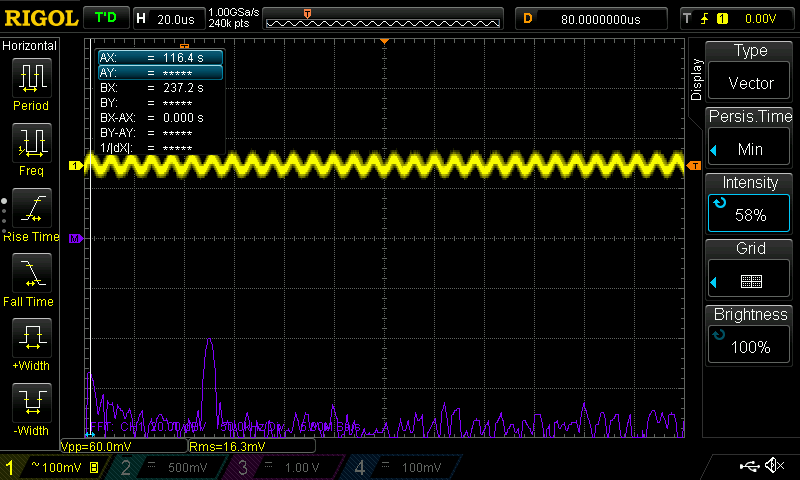
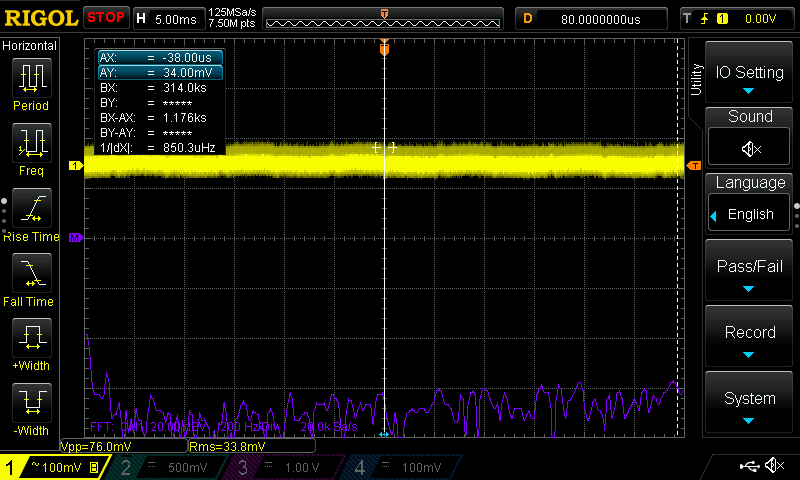
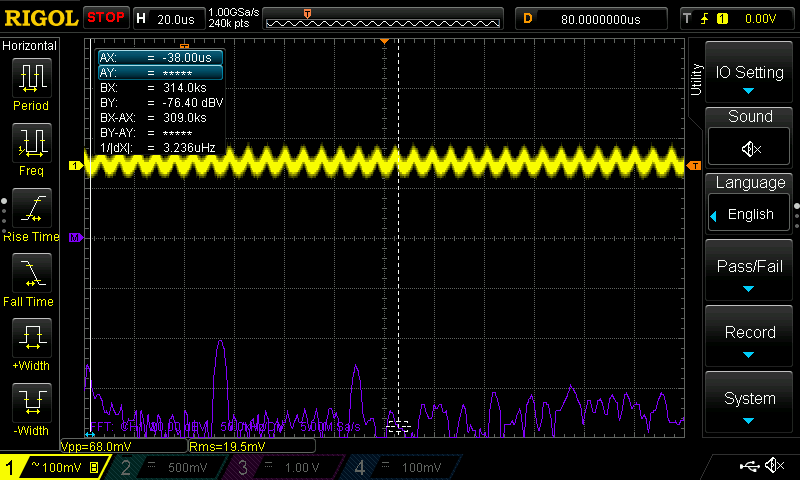
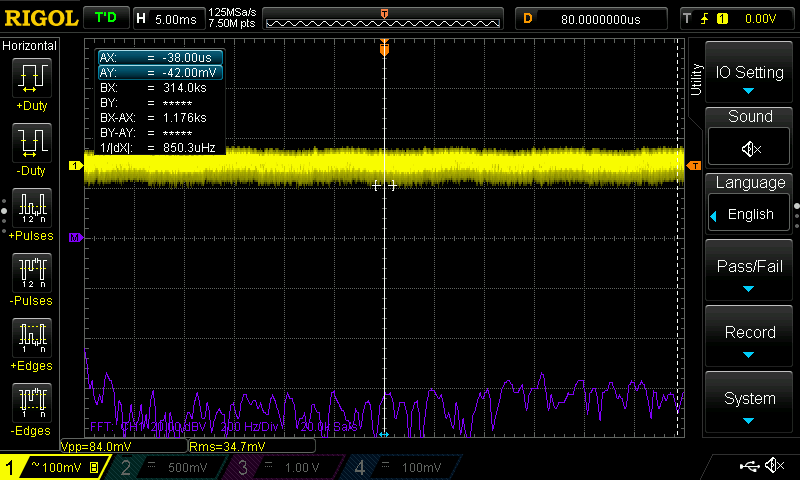
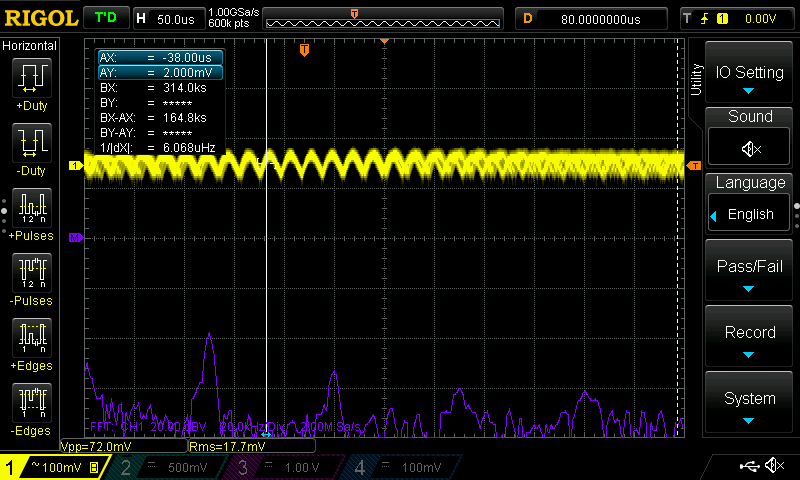
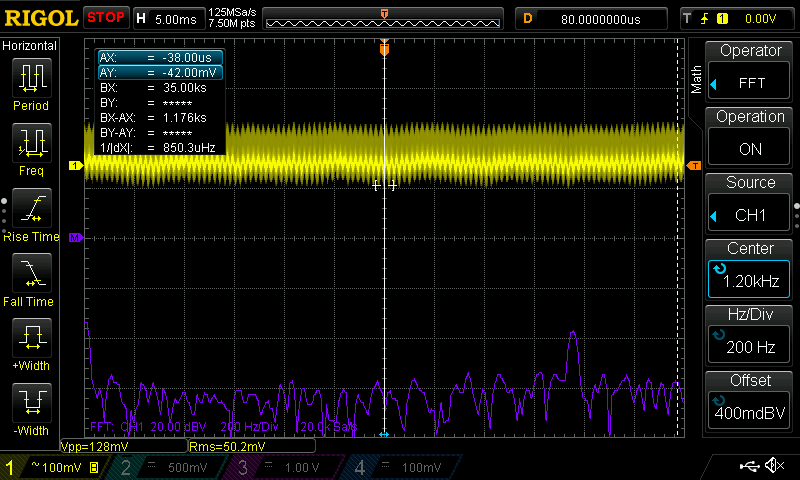
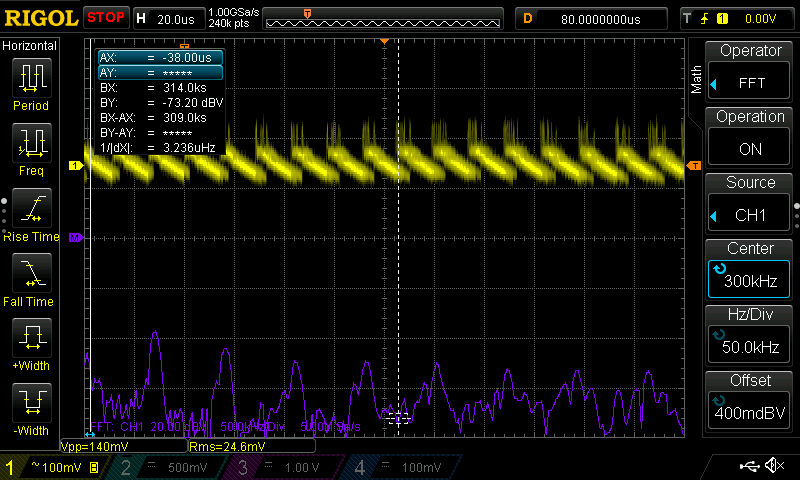
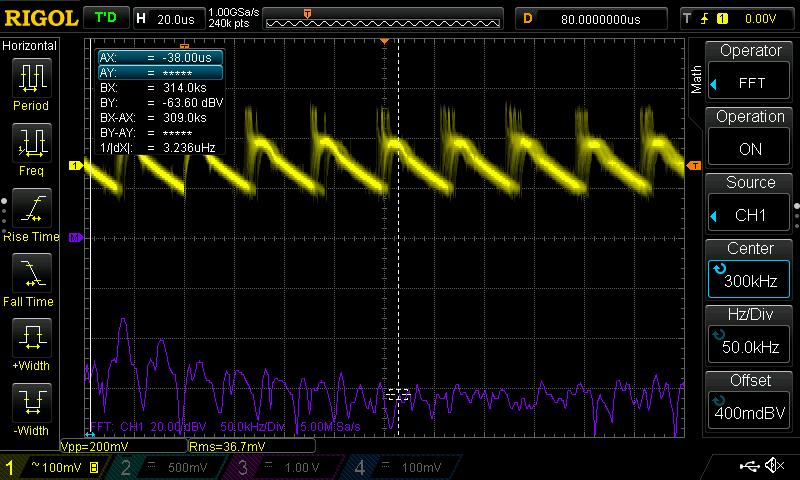
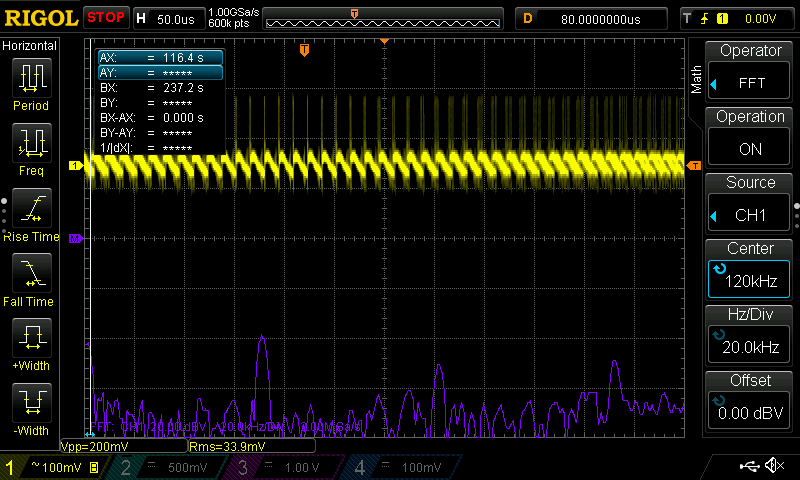
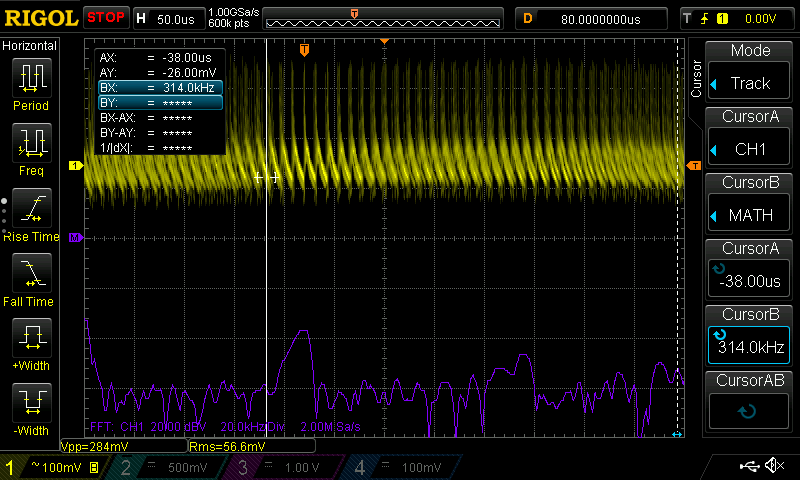
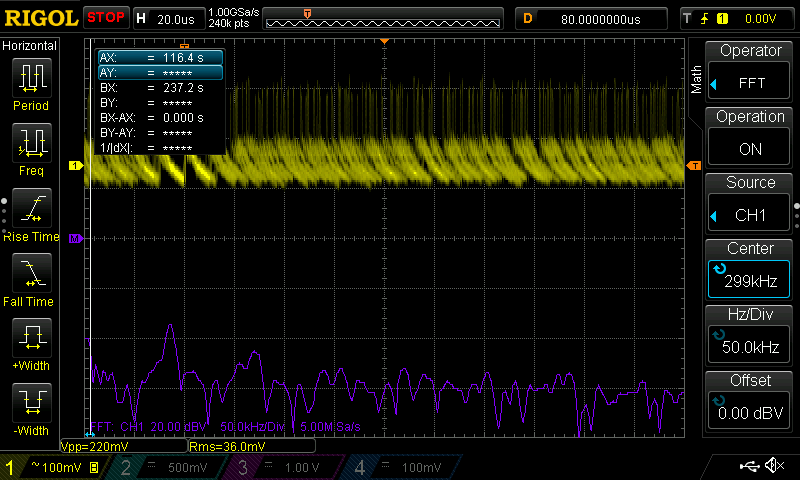
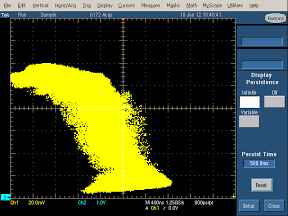
- Yellow Line (Voltage Trace): This represents the actual voltage being delivered to your device. The horizontal axis represents time, and the vertical axis represents voltage. In a perfect world, this would be a single, razor-thin, perfectly flat horizontal line. Any deviation from this is an imperfection.
- Purple Line (FFT Spectrum): You’ll see this purple mountain range near the bottom of many graphs. This is a Fast Fourier Transform (FFT). It takes all the imperfections from the yellow line and sorts them by frequency. A large spike here would mean there is a significant amount of energy at that specific frequency.
- Noise vs. Switching Ripple: This describes the imperfections on these graphs. It’s important to look at them separately:
- Switching Ripple is the presence of a main, high-frequency spike (and its harmonics) on the FFT. This is caused by the natural charging and discharging cycle of the charger’s internal circuit. AC Chargers will switch on and off many times per second to effectively create something that is DC current. For that reason, if there’s a significant peak at 90KHz and nowhere else, for instance, we’d say the charger has its primary switching ripple at 90KHz. If the charger has peaks at 90KHz and 180KHz, that is the switching ripple and its harmonic at 180KHz.
Note
-
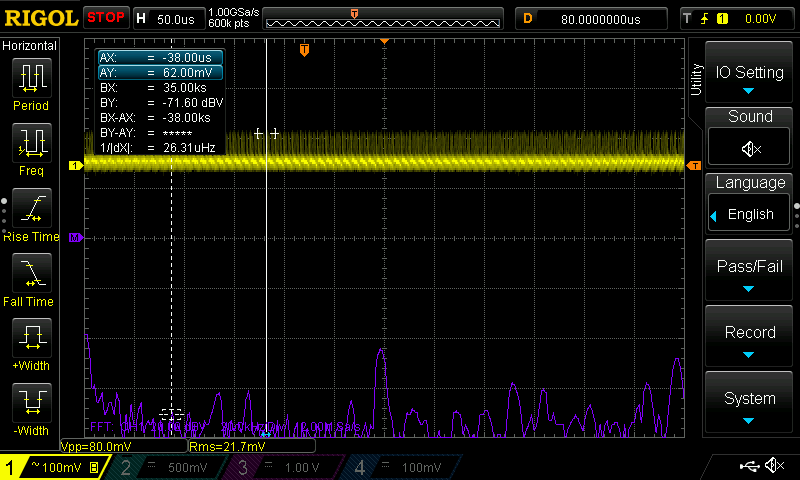
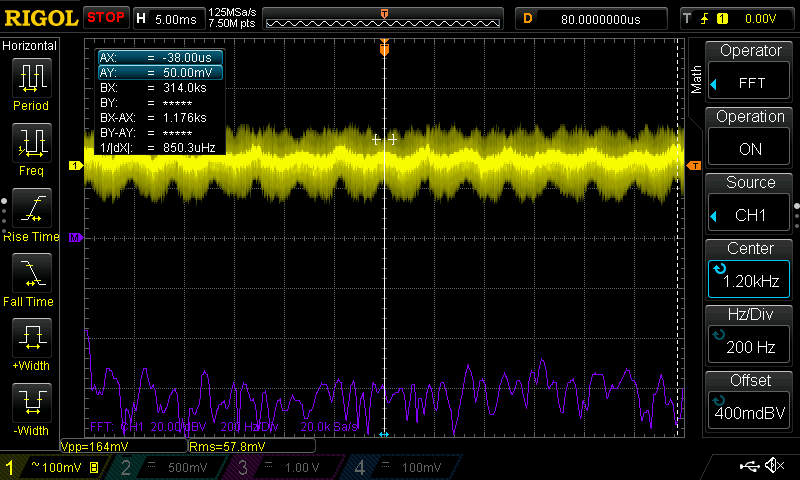
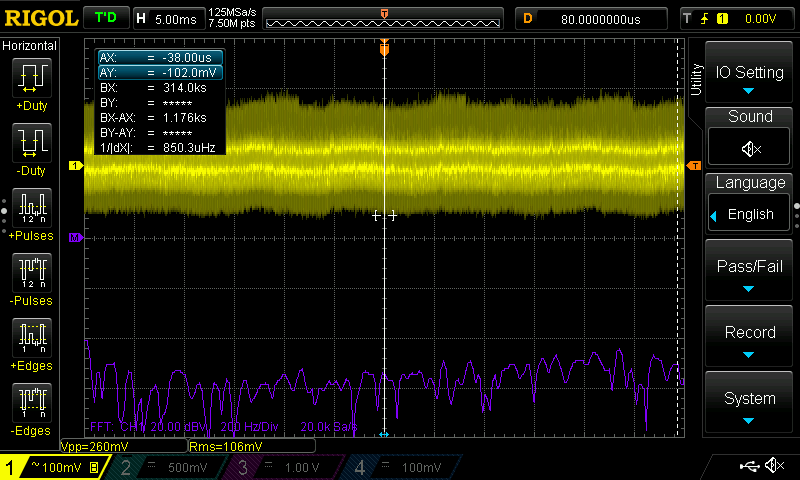
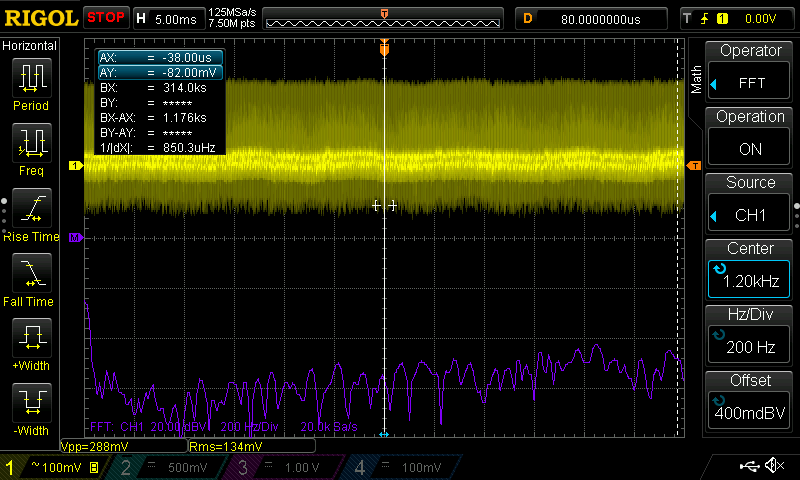
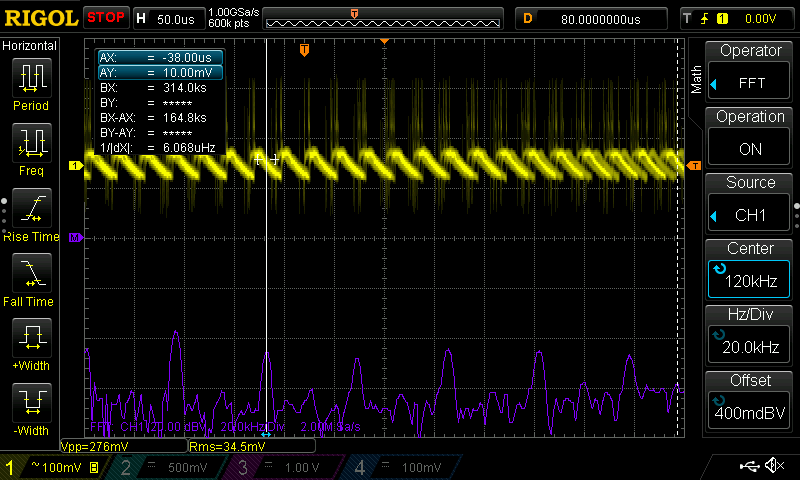
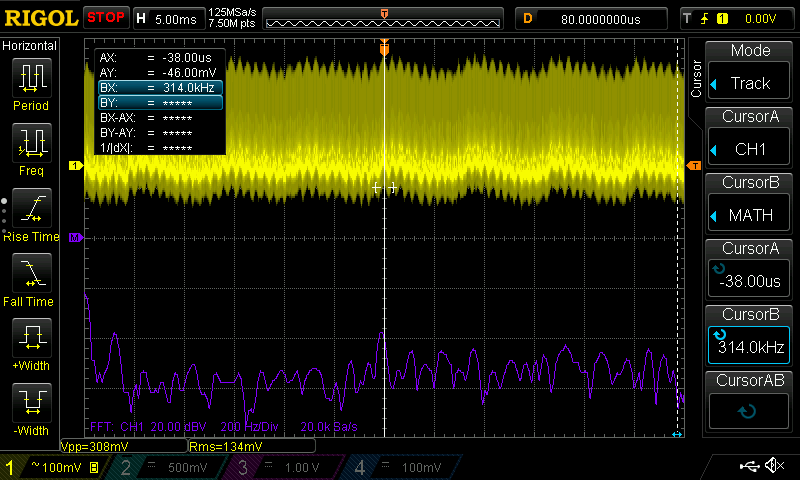
Noise includes any imperfections on the voltage graph measured in peak-to-peak voltage (Vpp). There are many different kinds of noise, including high-frequency vertical spikes, fuzzy blur, and general jitter. Switching ripple is one component of this.
-
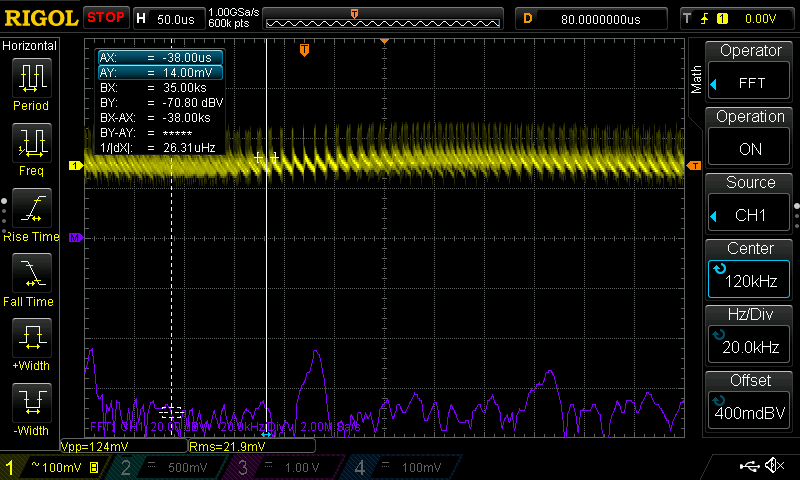
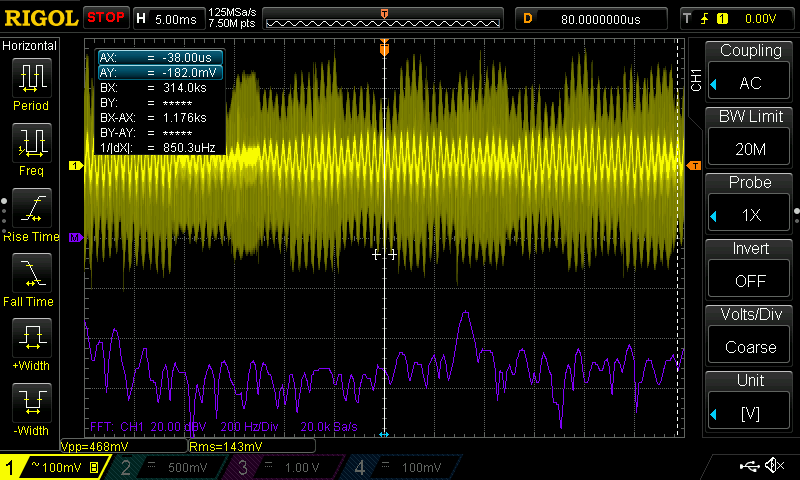
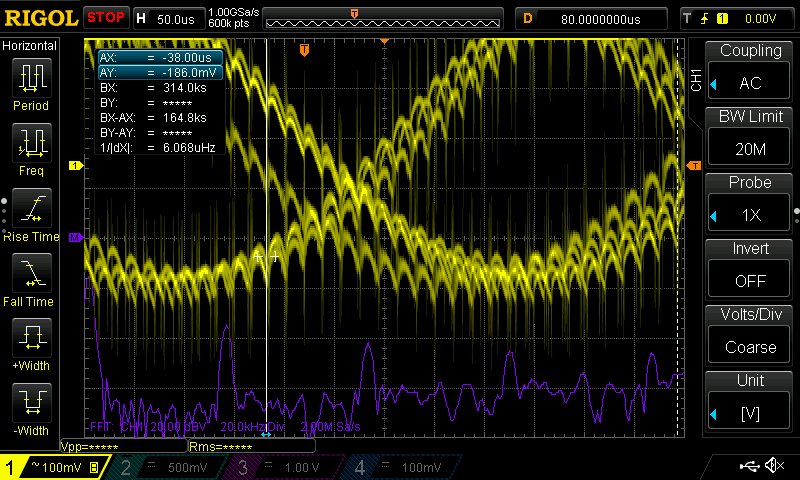
‘Fuzzy’ Blur: If the yellow line looks incredibly thick or “fuzzy,” it means the charger is constantly shifting its switching speed back and forth (frequency dithering) to dynamically smear its noise.
-
Good vs. Bad: A high-quality charger produces a thin, flat yellow line with minimal action on the purple FFT graph (ideally just one sharp needle representing its switching ripple). A poor-quality charger will have a thick, fuzzy yellow line (lots of jitter/noise), obvious rolling waves (line ripple), and many aggressive, evenly spaced harmonic spikes on the purple FFT graph (severe switching ripple).
Oscilloscope Graphs


Oscilloscope Graphs - Results Table
The DC items in here, like the Macbook Pro, are colored in grey to avoid conflating them with the AC chargers. They’re just included here for reference.
| Charger | Noise in mV | Noise Rating (Vpp and Spikes) | Switching Ripple Rating (FFT Harmonics) |
|---|---|---|---|
| Macbook Pro M1 | 24mV | ⚡︎⚡︎⚡︎⚡︎⚡︎ | ⚡︎⚡︎⚡︎⚡︎⚡︎ |
| Anker 621 MAG GO 5000mAh Battery | 36mV | ⚡︎⚡︎⚡︎⚡︎⚡︎ | ⚡︎⚡︎⚡︎⚡︎⚡︎ |
| Spigen PowerArc ArcStation Pro | 56mV | ⚡︎⚡︎⚡︎⚡︎⚡︎ | ⚡︎⚡︎⚡︎⚡︎⚡︎ |
| AOHI GaN 65W Charger | 60mV | ⚡︎⚡︎⚡︎⚡︎⚡︎ | ⚡︎⚡︎⚡︎⚡︎⚡︎ |
| Eero 15W Charger | 60mV | ⚡︎⚡︎⚡︎⚡︎⚡︎ | ⚡︎⚡︎⚡︎ |
| AOHI GaN 100W Charger | 72mV | ⚡︎⚡︎⚡︎⚡︎ | ⚡︎⚡︎⚡︎⚡︎⚡︎ |
| Anker 637 Magnetic Charging Station 2 - USB C | 76mV | ⚡︎⚡︎⚡︎⚡︎⚡︎ | ⚡︎⚡︎⚡︎⚡︎ |
| Counterfeit Chinese Wall ChargerUSB A Only | 84mV | ⚡︎⚡︎⚡︎⚡︎ | ⚡︎⚡︎⚡︎ |
| Apple 96W Macbook Charger | 92mV | ⚡︎⚡︎⚡︎⚡︎ | ⚡︎⚡︎⚡︎⚡︎ |
| Apple 30W Retail Charger | 96mV | ⚡︎⚡︎⚡︎ | ⚡︎⚡︎⚡︎ |
| Anker ASPD053a | 128mV | ⚡︎⚡︎⚡︎ | ⚡︎⚡︎⚡︎ |
| iPhone 17 pro | 136mV | ⚡︎⚡︎⚡︎ | N/A |
| Shargeek Macintosh Charger | 152mV | ⚡︎⚡︎⚡︎ | ⚡︎⚡︎⚡︎ |
| Govee Power Supply | 164mV | ⚡︎⚡︎ | ⚡︎⚡︎ |
| Anker A121B 100W Charger | 200mV | ⚡︎⚡︎ | ⚡︎⚡︎ |
| Dealworthy Charger | 212mV | ⚡︎⚡︎ | ⚡︎⚡︎ |
| Anker A121D 45W iPhone 17 charger | 244mV | ⚡︎ | ⚡︎⚡︎ |
| Counterfeit AT&T | 260mV | ⚡︎ | ⚡︎⚡︎ |
| Amazon Kindle Charger | 288mV | ⚡︎ | ⚡︎⚡︎ |
| Apple HomePod Mini Charger | 308mV | ⚡︎ | ⚡︎⚡︎ |
| Vebner GaN 65W Charger | 332mV | ⚡︎ | ⚡︎ |
| Counterfeit Samsung | 468mV | ⚡︎ | ⚡︎ |
Expected/Actual Output
Note
Our setup was not robust enough to handle testing at the full 65W or 100W that certain chargers are rated for. That is why we tested each charger at one of its max current/voltage configurations. Say Charger A is called a "65W" charger on the box. Charger A supports:
- 20V, up to 3.25 A (to reach max power of 65W)
And it also supports:
- 5V, up to 3 A
- 9V, up to 3 A
- 12V, up to 3 A
- 15V, up to 3 A
In this case, we'd do base level testing to see if we can get the charger to output its max power for a second or two. Then, for the oscilloscope traces, we'd drop the device down to something like 9V and cycle through all its current levels. This avoids overheating our breakout board. As stated earlier, all chargers showed similar noise profiles at their different voltages, so we're confident that the results you see below are reliable.
The Actual Voltage column is highlighted green if the measured voltage is within ±5% of the nominal output voltage (the USB-C PD spec limit) and red if it falls outside that window in either direction. For example, a 5V output must stay between 4.75V and 5.25V.
Expected/Actual Output Table
The DC items in here, like the Macbook Pro, are colored in grey to avoid conflating them with the AC chargers. They’re just included here for reference.
| Charger | Attempted To Pull (W) | Actual Voltage (V) | Actual Current (A) | Actual Power (W) | Passes Spec? |
|---|---|---|---|---|---|
| Eero 15W Charger | 15 (5v, 3a) | 4.76 | 2.91 | 13.85 | ✓ |
| Shargeek Macintosh Charger | 27 (9v, 3a) | 8.9 | 3.0 | 27.0 | ✓ |
| Apple 30W Retail Charger | 30 (20v, 1.5a) | 20.04 | 1.42 | 28.45 | ✓ |
| Apple HomePod Mini Charger | 19.98 (9v 2.22a) | 8.90 | 2.23 | 19.85 | ✓ |
| Vebner GaN 65W Charger | 27 (9v, 3a) | 8.64 | 3.04 | 26.26 | ✓ |
| Govee Power SupplyUSB A Only | 10 (5v, 2a) | 5.04 | 2.02 | 10.18 | ✓ |
| Counterfeit AT&TUSB A Only | 10 (5v, 2a) | 5.38 | 2.01 | 10.81 | ✗ |
| Counterfeit Samsung | 10 (5v, 2a) | 4.4 | 2.0 | 8.9 | ✗ |
| Amazon Kindle Charger | 9.36 (5.2v, 1.8a) | 5.30 | 1.81 | 9.59 | ✗ |
| Counterfeit Chinese Wall ChargerUSB A Only | 10.5 (5v, 2.1a) | 4.5 | 2.13 | 9.6 | ✗ |
| Dealworthy Charger | 20 (12v, 1.67a) | 11.97 | 1.57 | 18.79 | ✓ |
| Anker 621 MAG GO 5000mAh Battery | 12 | 4.74 | 2.43 | 11.54 | ✗ |
| iPhone 17 pro | 4.5 | 4.81 | 1.12 | 5.39 | ✓ |
| Macbook Pro M1 | 15 (5v, 3a) | 5.05 | 3.03 | 15.30 | ✓ |
| Anker ASPD053a | 27 (9v, 3a) | 8.88 | 3.02 | 26.82 | ✓ |
| Apple 96W Macbook Charger | 45 (15v, 3a) | 15.08 | 3.02 | 45.54 | ✓ |
| AOHI 100W GaN Charger | 36 (12v, 3a) | 11.82 | 3.02 | 35.52 | ✓ |
| Anker 637 Magnetic Charging Station 1 - USB A portUSB A | 12 (5v, 2.4a) | 5.13 | 2.42 | 12.41 | ✓ |
| Anker 637 Magnetic Charging Station 2 - USB C port | 36 (12v, 3a) | 11.79 | 3.02 | 35.65 | ✓ |
| Spigen PowerArc ArcStation Pro | 27 (9v, 3a) | 8.91 | 3.02 | 26.91 | ✓ |
| Anker A121D 45W iPhone 17 Charger | 45 (15v, 3a) | 14.82 | 3.03 | 44.90 | ✓ |
| Anker A121B 100W Charger | 45 (15v, 3a) | 14.99 | 3.02 | 45.26 | ✓ |
| AOHI GaN 65W Charger | 36 (12v, 3a) | 12.13 | 3.02 | 36.63 | ✓ |
Overcurrent Testing
The last piece of Ken Shirriff’s testing we wanted to replicate was overcurrent. Naturally, since devices get to decide how much current they want to pull, it’s up to the charger to make sure the device doesn’t pull too much current. Chargers generally have two strategies to deal with this: 1) shut off completely, or 2) reduce the output voltage. Option 1 is preferred in most cases. Option 2 is really just a consequence of not doing option 1. There is a third scenario, where the charger can somehow increase the current at the same voltage, but this would probably mean overheating it.
Note
During overcurrent testing, we set the electronic load to keep pulling more and more current until the charger shut off. While Ken was able to display the relationship between voltage and overcurrent on beautiful time-based graphs, we lack that recording capability. So our results are very simple.
In case you're interested, all my voltage graphs were relatively tight during overcurrent testing, and we only had one charger (Counterfeit Samsung) that completely blew the test. The others did a great job of keeping their voltage within a reasonable range, even during overcurrent. For that reason, we would say the values below are the true values of the voltage and current of the device at their shutoff period.
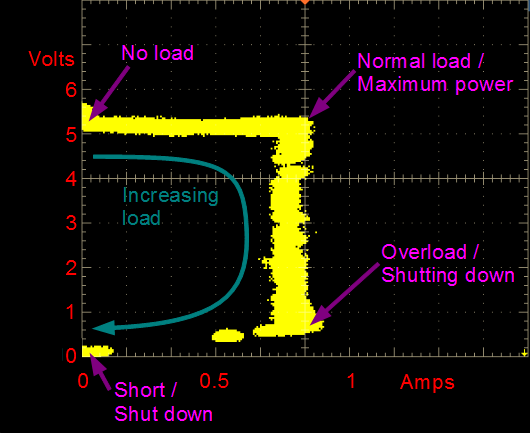
The ideal value here is having a voltage equal to 5V or 9V. You don’t want 3 or 4 volts, or 7 or 8 volts, because that suggests the charger allowed more current out than it should have.
We don’t have overcurrent results for all chargers in the table below. This will be updated as more test results become available.
Overcurrent Results Table
| Adapter | Difference between advertised Current and Current at shutoff | Difference between advertised Voltage and Voltage at shutoff | Difference between advertised Power and Power at Shutoff (W) |
|---|---|---|---|
| Vebner GaN | 0.42 | 0.13 | 2.5 |
| AOHI GaN 100W | 0.6 | 0.13 | 3.5 |
| Anker A121B 100W GaN Charger | 0.35 | 0.12 | 2.2 |
| Anker A121D 45W iPhone 17 Charger | 0.44 | -0.09 | 1.9 |
| Anker 637 Magnetic Charging Station 2 - USB C port | 0.7 | -0.22 | 7.6 |
| Apple HomePod Mini (20W) | 0.42 | -0.11 | 1.7 |
| Apple 30W Retail | 0.17 | -0.14 | 0.4 |
| Apple 96W | 0.46 | -0.37 | 1.1 |
| Amazon Kindle | 0.1 | -0.4 | -0.2 |
| Spigen PowerArc ArcStation | 0.22 | -0.27 | 0.2 |
| AOHI GaN 65W Charger | 0.33 | -0.3 | 0.7 |
| Eero 15W Charger | 0.36 | -0.31 | 0.8 |
| Counterfeit Chinese Wall Charger | 0.23 | -0.57 | -0.2 |
| Counterfeit Samsung | 0.81 | -1.2 | 0.64 |
A mixed bag of results from overcurrent. The Kindle is the most disappointing one in my opinion, because it shut off so quickly at just 0.1 A above its rated current, and somehow its voltage still dropped. However, the worst offenders are from the Apple 96W, Spigen PowerArc, Eero, and the counterfeit Chinese wall charger. All had voltage drops that suggest they go below what would be considered USB standards.
A new update: I re-ran the tests one more time with a brand new multimeter and updated the table. Upon reviewing, the Spigen, Apple 96W, Counterfeit Chinese wall charger, AOHI GaN 65W, and Amazon Kindle, and Eero are all starting to break past the +/- 5% voltage threshold for USB certification. I re-tested them under the oscilloscope, and found some interesting results: while most of these chargers offered relatively focused voltage traces, usually ranging by about 0.1V, the counterfeit Samsung was the one outlier. This charger had such a noisy voltage trace that, near shutoff, it oscillated between 3.7 V, 0, and 8.5 V. This dangerous behavior was truly unique and not present in *any of the other chargers I tested. When your phone or laptop attempts to pull too much current, this charger will start sending massive shockwaves of voltage.*
—
Conclusion
Wow, that was a lot. Evaluating chargers seemed quite difficult at first, but this whole project quickly turned into something exciting. What I liked most about this is that you don’t need to be an electrical engineer to see the difference between good and bad chargers. The oscilloscope really does make it obvious. Things get confusing when you go past the ‘what’ and try to start understanding the why. Why certain peaks appear in the FFT, why some scope traces look as bad as they do, or why a charger measured fine at 1A but looked terrible at 2.5A. I don’t think Spencer or myself have great answers to these.
The practical takeaway, in my opinion, is that most name-brand chargers of today are unlikely to damage your phone battery. Since modern devices filter noise internally, and the majority of these chargers stayed within that USB spec of ±5% voltage tolerance, they’re unlikely to be a problem. Just avoid excessively cheap, no-name chargers and you should be fine.
I hope you enjoyed reading. This really was a pleasure to put together. Car chargers are next on my list, and I suspect that may be a story of its own. If you have any suggestions to make, corrections to add, or just want to share something you found interesting, feel free to reach out and let me know. Contact is on the About page.
-Sean
Last thing: a huge shout out to both Ken and Spencer! I could not have done this without either of them.
Sean Sullivan
A Dozen Chargers in the lab
Appendix
[A1] Tip: If you want to do testing of your own, always use the spring ground clip. Using the default alligator ground clip will lead to extremely high noise ratings.